If you have purchased an environment monitor and configured environment monitoring to write to a database then you can view the temperature / humidity history with the Environment page.
|
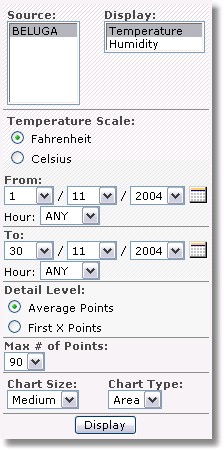
You can configure the following options:
Temperature Scale: When viewing the temperature, select whether to view the temperature in degrees Fahrenheit or degrees Celsius.
Detail Level: When you have a lot of data collected then it is sometimes impossible to display every value in the chart. Instead, only every "Max # of Points" is displayed.
For example, if the display interval contains 100 entries and "Max # of Points" is set to 20, then only every 5th data value is displayed. When you change the max points to 50, then every 2nd value would be displayed.
Setting this option to "First X Points" retrieves only the first "Max # of Points" from the database, ignoring later values.
Chart Size & Type: Adjust the size and display type of the chart.
|
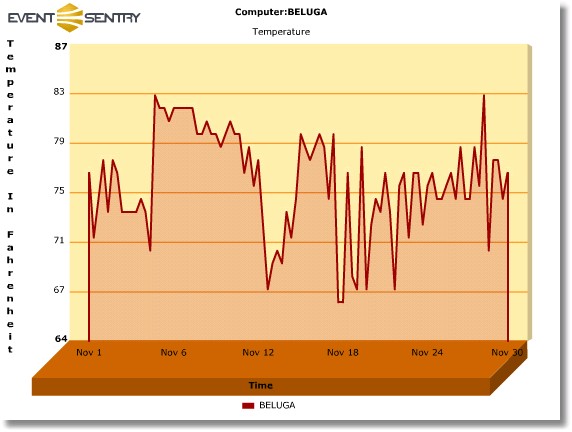
A typical query will look like this, spanning one month from the 1st of November to the 30th of November.

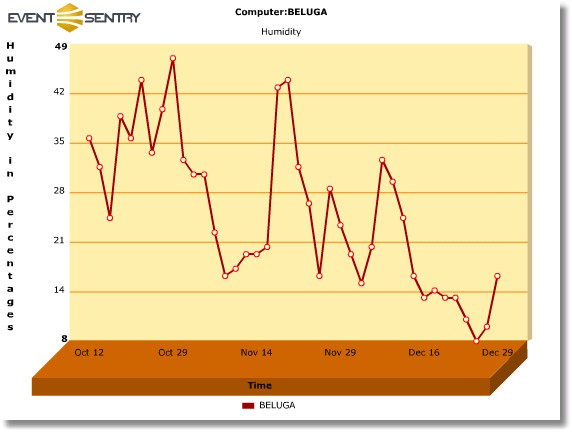
The graph below shows the humidity levels from October through December. You can notice a declining trend:

