If you have configured disk space monitoring to write to the database (Configuring EventSentry -> System Health -> Disk Space Monitoring -> Trend History Collection) then you can view disk space trends with the Disk Charts page. Note that all values are shown in megabytes.
|
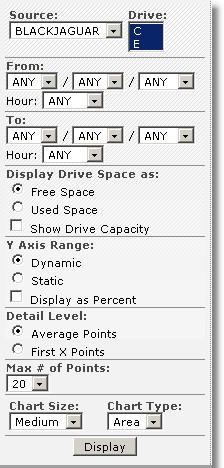
You can configure the following options:
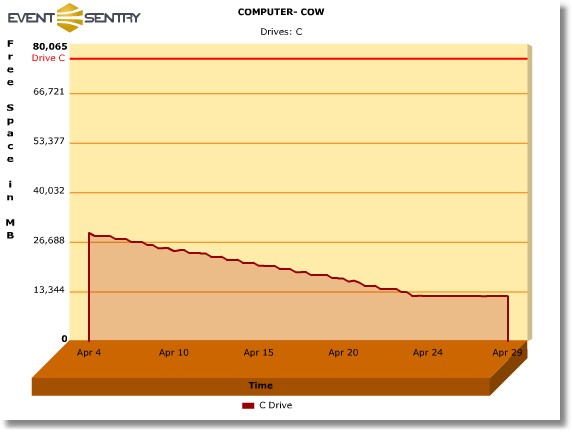
Display Drive Space as: You can either review the free or used space of the drive. If you click the "Show Drive Capacity" checkbox then you will see an additional line in the chart indicating the full capacity of the drive.
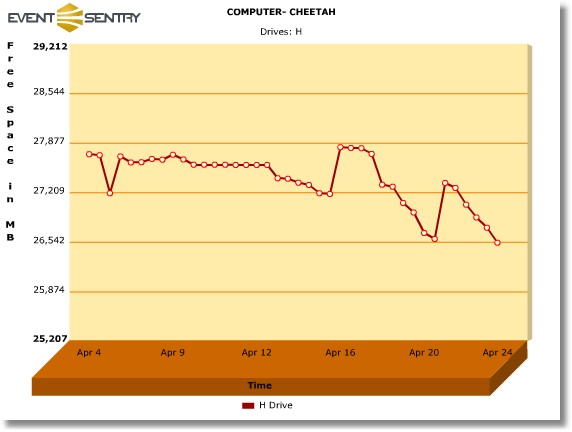
Y Axis Range: By default you will not see the full range from 0 to the actual free/used space, instead the vertical axis will adjust itself automatically to the max and min values of the current trend line. This will show smaller changes better.
Select the "Static" option to display all values in the Y axis. Select "Display as Percent" to view the trend in percent rather than in Megabytes.
Detail Level: When you have a lot of data collected then it is sometimes impossible to display every value in the chart. Instead, only every "Max # of Points" is displayed.
For example, if the display interval contains 100 entries and "Max # of Points" is set to 20, then only every 5th data value is displayed. When you change the max points to 50, then every 2nd value would be displayed.
Setting this option to "First X Points" retrieves only the first "Max # of Points" from the database, ignoring later values.
Chart Size & Type: Adjust the size and display type of the chart. |
A typical query will look like this, notice the full capacity line in red at the top of the output:

Screenshot with the Line chart type:

