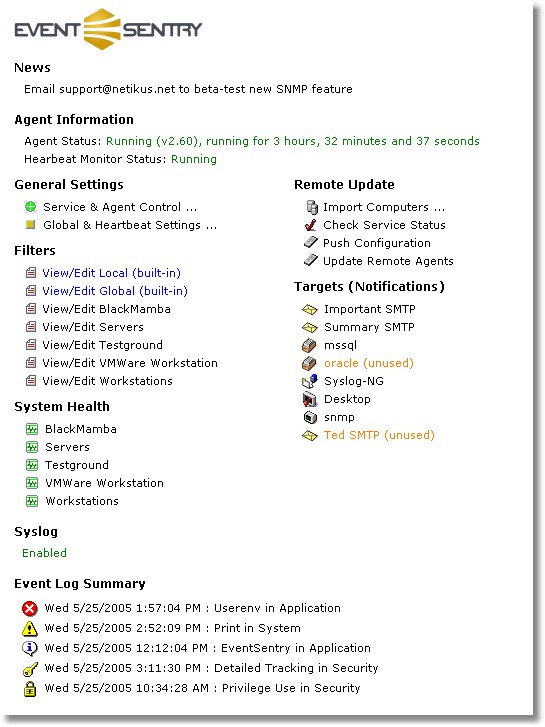
The Welcome Screen is displayed in the Details Pane after you started the EventSentry management interface. To view the welcome screen manually click on the root computer item.
The Welcome Screen will show you the following information:

News
This information is downloaded from the EventSentry web site and displays the latest news about EventSentry.
General
The service status including the version and the uptime of the service. The heartbeat monitor service status is displayed only if the heartbeat agent is installed.
General Settings
You can quickly access all "global" options through these two shortcuts.
Filters
The Filters section lists all groups that may contain filters (heartbeat-only groups are not listed here). Click on a group name to view a list of installed filters.
System Health
This section lists all groups that may have system health settings, you can click on the group name to view and/or change the system health settings of that group.
Targets
This lists all installed targets. If a target is disabled it will be printed in red with the note (disabled) next to it. You can click on a target name to edit it.
Remote Update
These shortcuts allow you to perform the most common remote update actions directly from the welcome screen. Please note that any remote action chosen here will affect all computers.
Syslog
Shows Enabled If the syslog daemon is enabled, otherwise Disabled is displayed. You can click on the text to edit the syslog settings.
Event Log Summary
This shows the most recent event log entry from each event log severity:
| • | Error |
| • | Warning |
| • | Information |
| • | Audit Failure |
| • | Audit Success |
including the day & time of occurrence, the event source and the event log where the event was logged. You can click on the text to view the details of the event with the built-in event log viewer.
Note: The event log summary is only calculated once. To refresh the event log summary (= rescan the event logs) right-click the welcome screen and click on Refresh.
See General Options for information on how to customize the welcome screen.